
03 · Scalable Growth
Management Dashboard
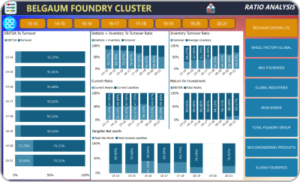
Industry KPI identification and Power BI visualisation, benchmarked against best performers.
The business problem
Leaders need to see exceptions quickly rather than read every report. Dashboards make key KPIs visible and comparable.
Who should consider this
- Promoters and CEOs wanting a live view of KPIs
- CFOs moving from spreadsheets to visual reporting
- Businesses already capturing data in an ERP
Scope
What GFP assesses or provides
- Industry KPI identification
- Visualisation of existing KPIs through Power BI
- Benchmarking existing KPIs with best industry performers
- Data collection support for new KPIs
- Predictive analytics through scenario building
- Exception-based reporting for transactional decisions
Method
How it works
- 1
Understand
An initial discussion about your business, priorities and how KPI reporting works today.
- 2
Assess
Structured review of current processes, data and ownership against GFP's assessment model.
- 3
Prioritise
Gaps are identified and ranked so you know what to address first and who owns it.
- 4
Build
Agreed improvements are implemented progressively, with measurement and review.
Outputs
Deliverables
- Power BI management dashboards
Questions
Frequently asked
Which tool do you use?
The current site references Power BI for visualisation.
Connected approach
Related services
MIS Design & Development
A customised MIS reporting model for operational and financial decision-making.
Learn morePerformance Management: KRA/KPI Mapping
Defining roles, KRAs and KPIs so accountability is clear and performance can be measured.
Learn moreERP & IT Infrastructure Assessment
Assessment of ERP usage and IT infrastructure against how the business actually operates.
Learn moreDiscuss Management Dashboard for your business
Start with a discussion about your business, growth priorities and the issues that need attention.